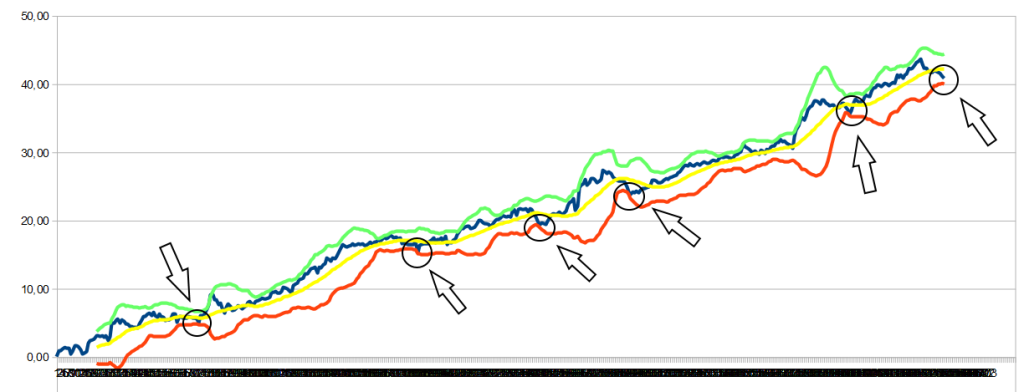
Equity curve oversold territory – Perfect entry zone for Nightly Patterns!
It has happened only 6 times since October 2012 so far. The Nightly Patterns equity curve is reaching the lower Bollinger Band (red line), it means we have a very bad performance during last few months and we are facing very strong returns forward. Have a look at what has happened the last 5 times. If you are looking both to increase the exposure to overnight trading (adding funds) or to just start trading Nightly Patterns, this is the right time. It only comes once in a year on average or even less often.
We can have a few bad trades more on the track coming, but not many. And of course, many good profitable returns coming. This is what Nightly Patterns history teaches. I’ll be glad to answer your questions at: nightlypatterns@hotmail.com


