This futures trading room focusses on high leverage Overnight Trading with futures:
“Just open the trade at the close and, if not stopped, close it at the open.”
One of the main advantages of the Nightly Patterns trading style is that it gives traders the opportunity to trade at a specific time, avoiding constant market screening. Furthermore, it allows traders to keep their money in cash during the day, making it possible to add Overnight Trading to other Intraday Trading strategies. Its unique time horizon makes this trading style completely uncorrelated to most other strategies, leading to superior portfolio diversification.
To download the results excel sheet follow this link: TRADING RESULTS
Have a look at my over 400 PATTERNS library following this link: PATTERNS LIBRARY
This picture shows NIGHTLY PATTERNS’ backtested equity growth back to 1993:

Below you can see total gains and net gains with live trades since October 2012:

I considered Interactive Brokers fees of $0.85 per trade per contract.
If you find something better, (including costs and fees) just write me. I’m always looking for new strategies to add to my portfolio.
If you want to subscribe NIGHTLY PATTERNS follow the procedure here:

–
“I search nightly patterns like people in the north look for Aurora Borealis.”

GLOBAL TRADE TITAN AWARD
Nightly Patterns belongs to the 10 best sites
out of more than 1358 global futures trading rooms
again in 2018, since 2014

WHO ARE THE GLOBAL TRADE TITANS?
Check them all at:
WWW.GLOBALTRADETITANS.COM
I swing traded as a PROTRADER at:
VERIFIED INVESTING
and my full trading strategies portfolio:
QUANTFOR
MY VISITORS GLOBE – WHERE DO TRADERS COME FROM?


It’s not easy to time the market. It’s almost impossible. But sometimes, when we are approaching very extreme stock market values, I mean extreme multiple values, extreme ratios, a stock market high call is due.
We have a few big problems with the stock market now.
- First inflation. Yes, everybody’s talking about it. Why? Because it’s 26 years we don’t have such strong inflation numbers. It means something big is waking up. Extreme numbers.
- Interest rates – rising inflation means, rising interest rates.
- CAPM pricing model – when interest rates rise, stock market prices fall.
- Where are interest rates now? In negative territory, never seen before. Would have William Sharpe ever thought about something similar back in 1964? No. Extreme numbers again.
- Why stock market prices are so high? Because of Fed Quantitative Easings, negative interest rates and extremely low inflation for years. Nothing to do with “new economy recovery”. Just financial formulas and Fed money printing.
- Where’s the Buffett Indicator now? In extremely overbougth territory, higher than ever before. Have a look at the scary, scary picture below.
- What about seasonality? Well, “Sell in May and go away!” Far away. Be careful guys!
Below you can see a rising wedge, starting with Covid April 2020 lows. If we go back there, it’s a 50% bear stock market reset. This could drive the Buffett Indicator to more normal values to trigger a buy. That’s why with overnight trading we have been so selective recently, maybe too much. We’ll have much more bearish overnight bets starting soon.

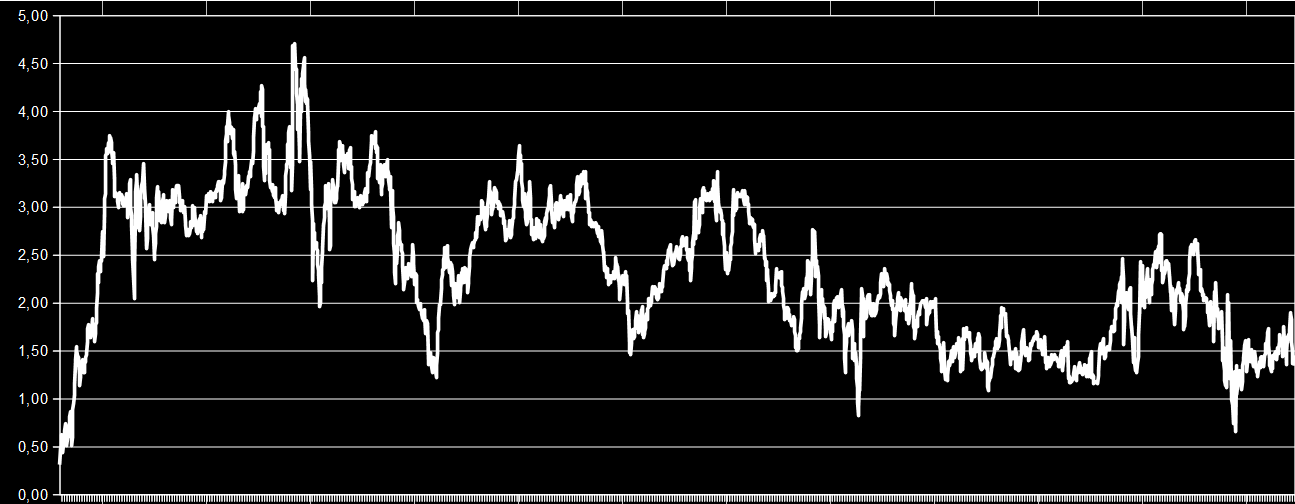
It has happened only 6 times since October 2012 so far. The Nightly Patterns equity curve is reaching the lower Bollinger Band (red line), it means we have a very bad performance during last few months and we are facing very strong returns forward. Have a look at what has happened the last 5 times. If you are looking both to increase the exposure to overnight trading (adding funds) or to just start trading Nightly Patterns, this is the right time. It only comes once in a year on average or even less often.
We can have a few bad trades more on the track coming, but not many. And of course, many good profitable returns coming. This is what Nightly Patterns history teaches. I’ll be glad to answer your questions at: nightlypatterns@hotmail.com


Where are the intraday stock market edges? When should a trader be long or short?
Well, those aren’t easy questions. Intraday seasonality does exist. You can have a look at the previous quarter of an hour here.
Now, I’m writing down a simpler approach: I’m splitting the the stock market session in 15 minutes different periods and see what’s happening with them. I have data back to 28 September 2009: last 10 years of data exactly. Intraday data are very difficult to handle, that’s why I’m focusing only on the last 10 years.
I’m backtesting the ES future market.
Let’s have a look at this quarter: 12:00 – 12:15 AM EST.
The equity curve below shows no bias at all.
If you had traded all those quarters of an hour at 12:00 AM EST blindly, going through all the wild moves, you would have lost and learnt to breakeven going long on ES futures contract, during the last 10 years.

I’ll be back soon with another intraday seasonality study,
Marco Simioni

Where are the intraday stock market edges? When should a trader be long or short?
Well, those aren’t easy questions. Intraday seasonality does exist. You can have a look at the previous quarter of an hour here.
Now, I’m writing down a simpler approach: I’m splitting the the stock market session in 15 minutes different periods and see what’s happening with them. I have data back to 28 September 2009: last 10 years of data exactly. Intraday data are very difficult to handle, that’s why I’m focusing only on the last 10 years.
I’m backtesting the ES future market.
Let’s have a look at this quarter: 11:45 – 12:00 AM EST.
The equity curve below shows no bias at all.
If you had traded all those quarters of an hour at 11:45 AM EST blindly, going through all the wild moves, you would have earned only 2% going long on ES futures contract, during the last 10 years.
I’ll be back soon with another intraday seasonality study,
Marco Simioni

Where are the intraday stock market edges? When should a trader be long or short?
Well, those aren’t easy questions. Intraday seasonality does exist. You can have a look at the previous quarter of an hour here.
Now, I’m writing down a simpler approach: I’m splitting the the stock market session in 15 minutes different periods and see what’s happening with them. I have data back to 28 September 2009: last 10 years of data exactly. Intraday data are very difficult to handle, that’s why I’m focusing only on the last 10 years.
I’m backtesting the ES future market.
Let’s have a look at this quarter: 11:30 – 11:45 AM EST.
The equity curve below shows the wildest edge ever.
If you had traded all those quarters of an hour at 11:00 AM EST blindly, going through all the wild moves, you would have earned only 4% going long on ES futures contract, during the last 10 years. It’s a strong uptrend during last few years, anyway.
I’ll be back soon with another intraday seasonality study,
Marco Simioni

Greetings traders,
Last Tuesday’s short trade – the entry was on August the 11th of 2020 – is described below:
Trade entry – Emini future price = 3329,5
Trade exit – Emini future price = 3359,5
Stop loss triggered – none
Take profit triggered – none
Trade loss = 30 Emini points
Trade loss in $ per contract = – $ 1500
The entry was on the blue circle on the left and the exit was on the second blue circle on the right. This trade was stopped out. Stop loss order was hit.
If you like to study deeper overnight trading results, please download my historical live trading results sheet here.
Regards,
Marco Simioni
Nightly Patterns

Greetings traders,
Last Monday’s short trade – the entry was on August the 10th of 2020 – is described below:
Trade entry – Emini future price = 3352
Trade exit – Emini future price = 3368,75
Stop loss triggered – none
Take profit triggered – none
Trade loss = 16,75 Emini points
Trade loss in $ per contract = – $ 837,5
The entry was on the blue circle on the left and the exit was on the second blue circle on the right.
If you like to study deeper overnight trading results, please download my historical live trading results sheet here.
Regards,
Marco Simioni
Nightly Patterns
Where are the intraday stock market edges? When should a trader be long or short?
Well, those aren’t easy questions. Intraday seasonality does exist. You can have a look at the previous quarter of an hour here.
Now, I’m writing down a simpler approach: I’m splitting the the stock market session in 15 minutes different periods and see what’s happening with them. I have data back to 28 September 2009: last 10 years of data exactly. Intraday data are very difficult to handle, that’s why I’m focusing only on the last 10 years.
I’m backtesting the ES future market.
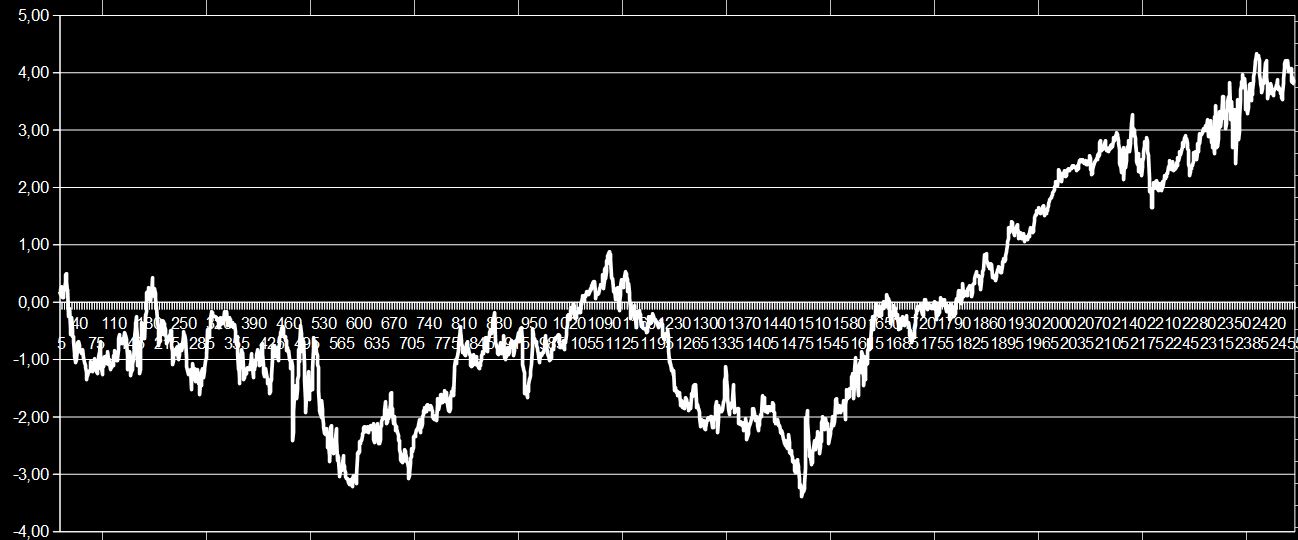
Let’s have a look at this quarter: 11:15 – 11:30 AM EST.
The equity curve below shows the wildest edge ever.
If you had traded all those quarters of an hour at 11:00 AM EST blindly, going through all the wild moves, you would have earned only 1% going long on ES futures contract, during the last 10 years.

I’ll be back soon with another intraday seasonality study,
Marco Simioni
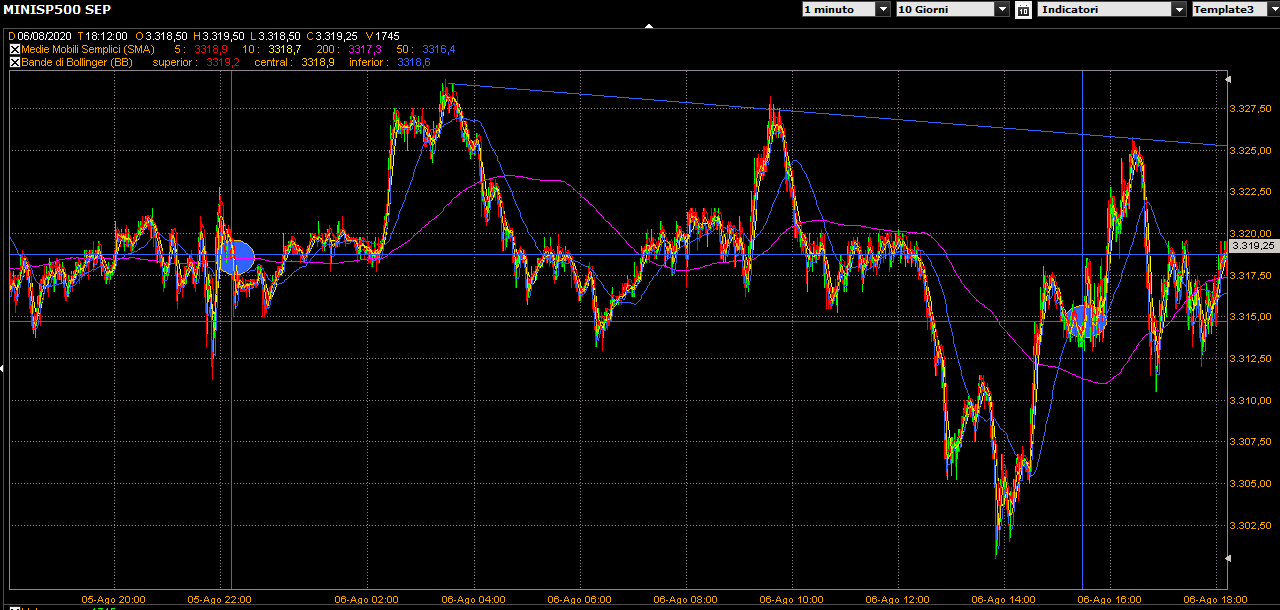
Greetings traders,
Last Wednesday’s short trade – the entry was on August the 5th of 2020 – is described below:
Trade entry – Emini future price = 3318,75
Trade exit – Emini future price = 3314,75
Stop loss triggered – none
Take profit triggered – none
Trade gain = 4 Emini points
Trade gain in $ per contract = $ 200
The entry was on the blue circle on the left and the exit was on the second blue circle on the right.
If you like to study deeper overnight trading results, please download my historical live trading results sheet here.
Regards,
Marco Simioni
Nightly Patterns
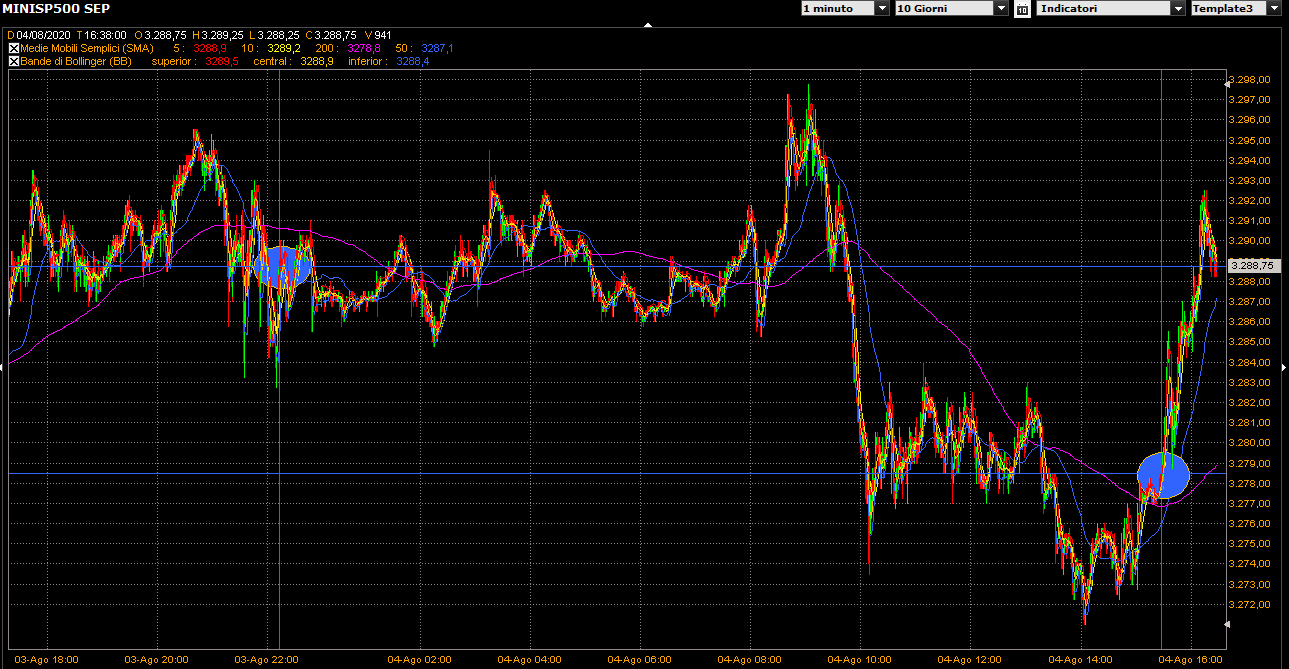
Greetings traders,
Yesterday’s short trade – the entry was on August the 3rd of 2020 – is described below:
Trade entry – Emini future price = 3288,75
Trade exit – Emini future price = 3278,5
Stop loss triggered – none
Take profit triggered – none
Trade gain = 10,25 Emini points
Trade gain in $ per contract = $ 512,5
The entry was on the blue circle on the left and the exit was on the second blue circle on the right.
If you like to study deeper overnight trading results, please download my historical live trading results sheet here.
Regards,
Marco Simioni
Nightly Patterns